By Susan Leclair
Introduction
The CBC or complete blood count is a collection of tests that, over time, has tried to answer what is going on in the bloodstream and what that means to the individual. Some of these tests might look as if they overlap but each has its unqiue meaning, advantage, and disadvantage.
RED BLOOD CELL COUNT
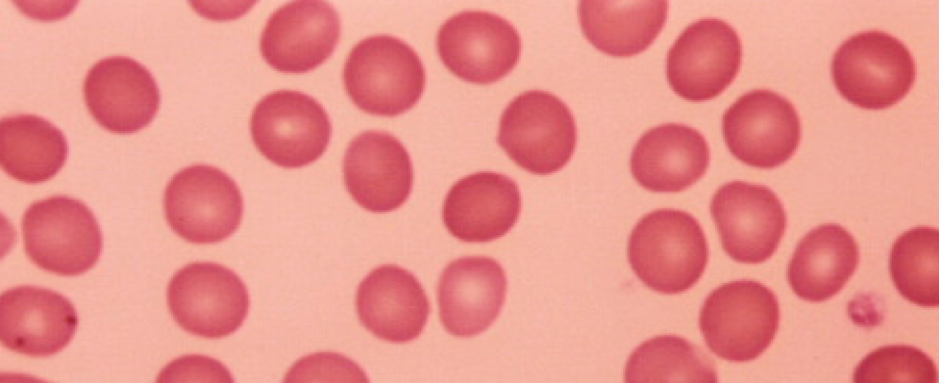
Think like a traffic engineer in a city. You need roads that must be balanced with the number of cars that will use them. You don’t want too many cars on too few roads but at the same time, you don’t want to limit the number of vehicles entering the road in favor of more green, free-flowing areas. So too in the blood stream, you need enough red blood cells to do their job efficiently and effectively. Thus, the simple “just count them” seems to answer that question. But the problem with a simple count, like a count of cars based on the number of wheels that go over a sensor in the road, is that it doesn’t tell you anything about the quality of the cells (or traffic). Are these wheels on small zip cars or are they on giant semi-trailers?
Obviously, a population of tandem trailer trucks will take more space, move less freely on a road, and will cause more damage to the road itself than the same number of small subcompacts. Historically too, the red blood cell count was not the most accurate of all tests since it involved multiple steps and manual mathematics. But over time, newer instrumentation has taken over all the steps in the red blood cell count and made it a much more precise (reproducible) result.
People with polycythemia vera (too many red cells) can have, as their red blood cell count rises, a jostling of cells and a general slowing down of blood flow due to the overcrowding in the bloodstream while people with any type of anemia can see that the lesser number of cars (like red cells in the bloodstream) makes the roads (or blood vessels) look very empty. Unlike roads which have a strong rigid construction, as the red blood cell count decreases, there is a tendency for the blood vessels to start to “flap” or collapse, damming blood flow. Both polycythemia vera and anemia end up causing blood flow stoppage, but by two totally difference mechanisms.
Hematocrit
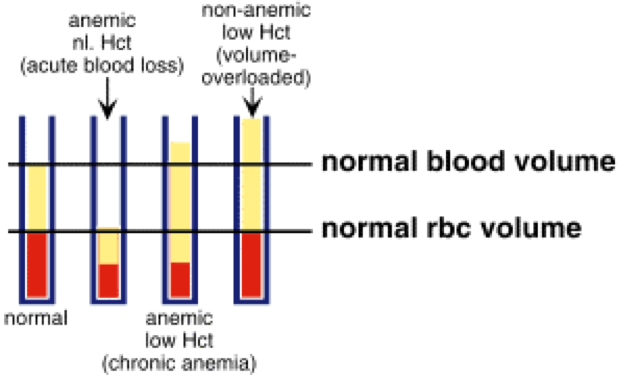
In the 1930s, Max Wintrobe thought that since red cells are quite heavy due to the high concentration of hemoglobin, you could separate the heavy cells from the liquid just by centrifuging it. The “spun” hematocrit, as it was called, became the single most accurate blood test in the clinical laboratory. As with all tests, it had a few limitations, but it gave you the ability to see the relationship between plasma volume and cell volume.
Hemoglobin
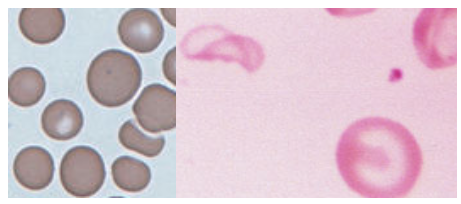
One limitation to the hematocrit was that it gave you a static number without giving any indication of whether the cells in question actually worked. The only reason to have a red cell is that hemoglobin can wander around freely in the blood stream. (Free hemoglobin hurts your kidneys.) One way to quantify hemoglobin is to measure the amount of iron. As it turns out, this is a pain, and worse yet, it didn’t deal well with those people who had the single most common anemia in the world – iron deficiency. During World War II, another method was developed to measure the hemoglobin’s ability to bind to another chemical, and the color change caused by this new compound can be measured. This is the method we still use today. Notice in these pictures that the left photo has cells that appear to be filled with a homogeneous substance while the right picture has cells that appear to have very little in them.
You can use all three of these measures (red blood cell count, hematocrit and hemoglobin) to figure out how many red cells there are, how much space they take up, and how much hemoglobin has been made. But these tests still don’t tell much about the quality of the cells. For that you need the red cell indices.
WINTROBE’S RED CELL INDICES PLUS 1
Yes, same guy. He wanted to know if you could picture what one cell looked like. For example, you have a population of vehicles traveling on the road and you want to know the average size of the vehicles or how heavy the average vehicle is. This turns out to be what was once 4th grade math – if 12 apples fit into a 1-quart container, how big is 1 apple? If I have 4.5 million red cells in a specific volume of blood and I know that the percentage of that total volume (hematocrit) is 45%, I can simply divide the hematocrit by the red cell in millions and get an average size or the Mean Cell Volume (MCV). This is a rather handy item as it can divide all anemias into conditions with large, small or normal cells. So, a physician can look at the MCV and instantly eliminate about 2/3 of possible conditions.
But if I can find the average size of the red cell population, can I find out how much hemoglobin is in the average cell? Yes, by using essentially the same math – instead of dividing the hematocrit by the red cells, you divide the hemoglobin by the red cell number in millions to arrive at the mean cell hemoglobin (MCH). You can then categorize cells based on having too little, just the right amount or too much hemoglobin.
Since in Dr. Wintrobe’s day, the red cell count was not the most precise of tests and both the MCV and MCH are calculated using the RBC, he did a work-around called the mean cell hemoglobin concentration (MCHC) which was the ratio of hematocrit and hemoglobin.
Finally, with the advent of newer instruments in the 1980’s, another question could be answered. In the photos just above this topic, you can see that the cells are not all the same size. If I took the sizes of 1 semi trailer attached to a tandem container-car load, a landscaper’s van, a school bus, an SUV, and two zip cars, I could get an average, but it wouldn’t tell me much about the type of vehicles on the road. But, if I could calculate the range of sizes (tandem trailer to zip car) in terms of how many of each were present, then I could get a sense of the degree of size deviation present in the traffic. So too with red cells. Normal red cells vary within 1 micron, so close that it is sometimes hard to distinguish that small a variation. As the bone marrow reacts to stress of any kind, that sameness in cell size is lost and you get increased variation in the range of cell sizes that correlates to the degree of stress experienced. This calculation can only be done by modern instruments and is called the red cell distribution width (RDW).
With these 7 tests, you can get a pretty good picture of your red blood cells – how many and of what quality, as individuals and as a population.
Susan Leclair is Chancellor Professor Emerita at the University of Massachusetts Dartmouth; Senior Scientist, at Forensic DNA Associates; and Moderator and Speaker, PatientPower.info – an electronic resource for patients and health care providers.
Originally published in The CLL Tribune Q2 2019.