 By Susan J. Leclair, PhD, CLS (NCA)
If you missed Part 1 of this article, please read Lies, More Lies, and Statistics.
Let us now consider what questions will be asked. One way to look at data is to see what commonalities are seen in a collection of data. For example, I might wish to determine what topics my students did particularly well on in the last exam. I could count every student’s answers. Random distribution would suggest that each question should have an equal shot at being correct. But life doesn’t work that way. Some topics are easier to grasp than others, or the time spent on a topic might not be as significant as that spent on another, and so on. When Carl Gauss first plotted these types of data, he discovered a distribution known as “normal distribution” or the dreaded Gaussian curve some teachers use for grades. It looks like this:
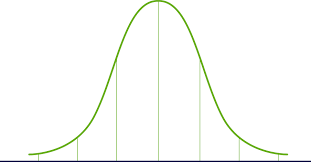
Let us say that there were 7 questions on this exam. This curve could be used to represent the data (percentage of students with correct answer) collected for each question 1-7, (each question shown from left to right across the horizontal axis). You can see that question 1 and 7 were not well understood by the students, while everyone got the correct answer for question 4.
Or:
Supposing there is a group of 2,000 people and I want to know if there is a commonality to their heights. Their graph would look a lot like the exam graph with the bottom axis being height in inches and the curve itself showing how many people were measured at each height. While the range of individual heights, for this example, is from 60 inches to 78 inches, the most common height is somewhere in the middle. This is called the mean or the average. According to the U.S. National Center for Health Statistics, the average height of an American adult male is 69 inches. Note that someone who is 78 inches is not abnormal, just uncommon, and if they had the talent and interest, they could become a basketball player.
Public radio had a program about a town, which claimed that all the children were above average. Instinct tells you that is not true, but there are situations in which the Gaussian curve does not work. For instance, look at pay scales. What is the yearly income of the average American male in the U.S.? We know that there is a small number of folks who earn millions to billons, while there are huge numbers who earn less than $30,000, and some who earn nothing because they are out of work. Then, what you want, is to know the median.
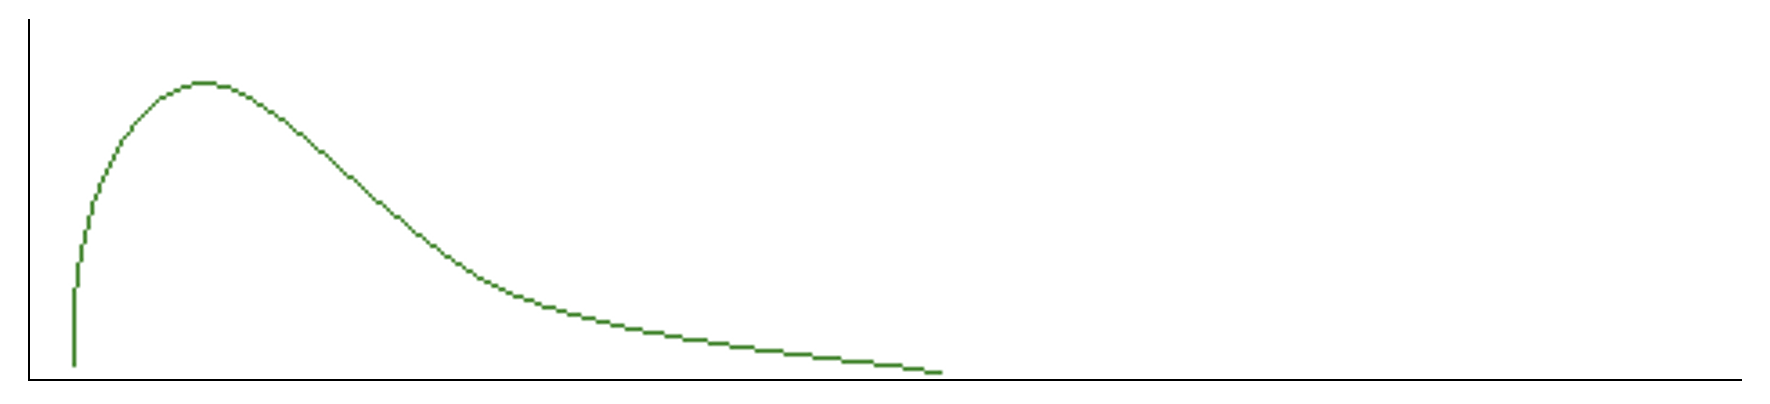 By counting and plotting this out, we can see from the graph above, that median income is not in the middle, but off to one side. While the ends are still true, the common median income is $47,000, meaning that half of the men in the United States earn less than $47,000 per year and half earn more, without specifying the extremes.
The third way to describe commonalities is called the mode, or how many times does something, or someone, occur. For example, you might be interested in knowing how many people make up each rank in the Army. Obviously, they range from private to 5-star general. But which rank contains the most people? That would be the mode. And it might look like this:
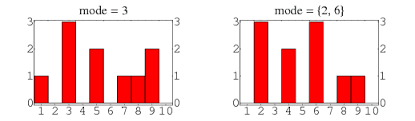 In the first graph, the most common number is 3 (private first class), while in the second graph, the mode is either private or lieutenant.
So, there are three different ways to look for a sense of commonality: mean, median and mode. The mean always assumes that there is a true, even, or random spread of data, while the other two assume that there is not.
Susan Leclair, PhD, CLS (NCA) is Chancellor Professor Emerita at the University of Massachusetts Dartmouth; Senior Scientist, at Forensic DNA Associates; and Moderator and Speaker, PatientPower.info – an electronic resource for patients and health care providers.