Weekly COVID-19 Statistics
Here is the CDC’s map of community level of spread (this map’s risk is weighted based on hospitalizations), and here is the link to the New York Times actual cases per capita map as shown below. The New York Times data was last updated December 26th.
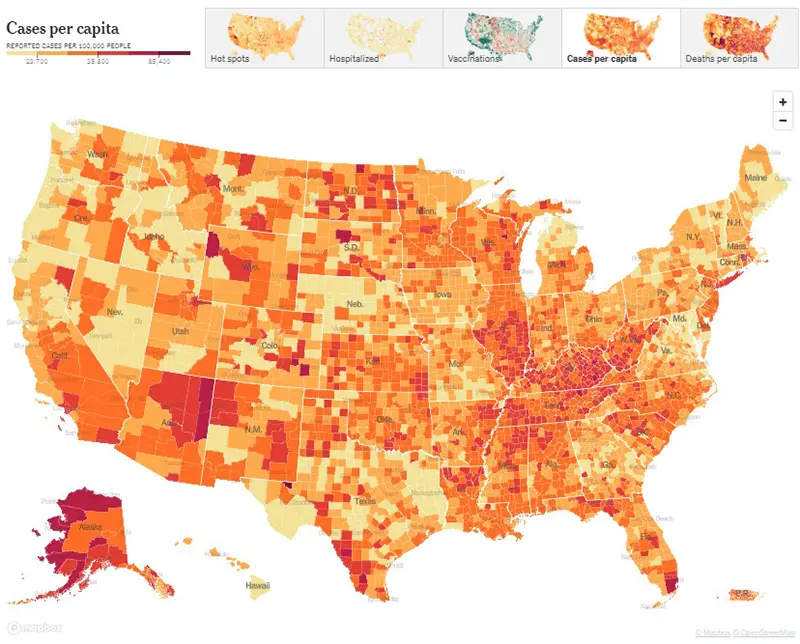
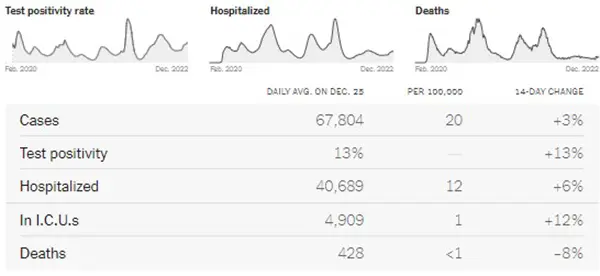
Here is the summary graphic from the New York Times. All data points have increased except for deaths. But it is important to consider this data does not paint the full picture this week, mainly due to health departments being closed (thus not reporting) for an extended 4-day holiday weekend.
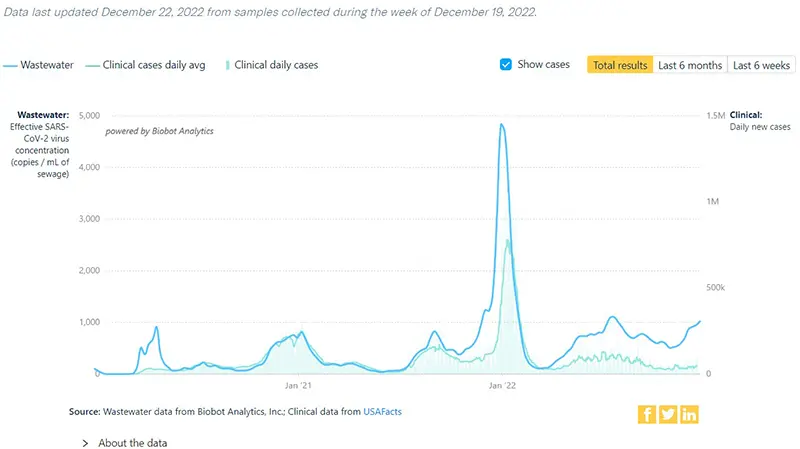
The COVID-19 Wastewater Monitoring Project last updated December 22nd paints the most accurate picture we can have this week, as wastewater levels are not dependent upon people testing or health departments being open. Note the sharp increase in the top dark blue line (the amount of virus measured in wastewater) compared to the lower light blue line (reported case numbers by health departments). Again, this verifies that actual case numbers are much higher than what is being reported, just as we have seen historically since the Omicron wave in January 2022 when COVID-19 home testing kits became more readily available.
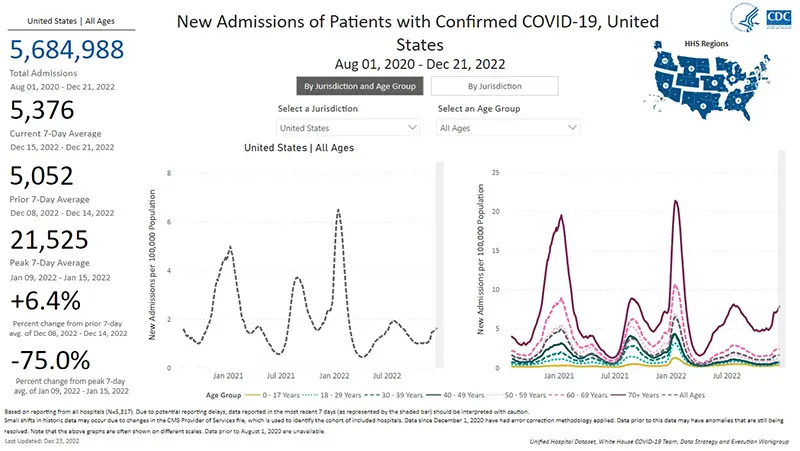
The rate of hospitalizations last updated on December 21st continue to indicate an increase in hospitalizations for COVID-19 in all age groups. The stark contrast in the increased hospitalizations for those over the age of 70 continues to show that those in that age group are at the highest risk right now.
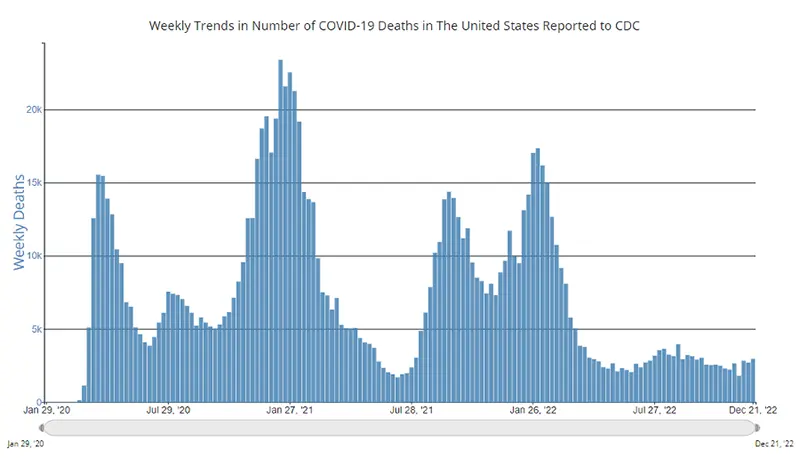
The weekly average number of COVID-19 deaths in the US ending the week of December 21st were 2,952. This is an increase of 249 deaths from the week prior. Of note, increases in COVID-19 death rates throughout the pandemic have always lagged behind any increases in case numbers and hospitalizations by 2-3 weeks.
Current & Emerging Variants of Concern (VOC)
BQ.1 and BQ.1.1 combined are now 69.1% of new cases this past week. Here is the overall breakdown of variants in the US according to the CDC’s Variant Tracker as of December 24th.
And here is the breakdown by regions within the United States as of December 24th. (We continue to highlight how much BA.5 is left by region because it is the main one that Evusheld still works against). As you can see, variations still exist depending on where you live in the US.
Here is what we know about the current variants of concern and how they hold up against Evusheld:
Data indicate Evusheld will still provide protection against the following variants (percentages are national averages). Note that these overall percentages of variants that continue to have neutralizing capacity against the virus continue to decrease week over week:
- BA.5 (6.9%)
- BN.1 (3.8%)
- BA.2.75 (1.0%)
- BA.2 (0.5%)
These four variants together make up ~12.2% of cases on average nationwide as of December 26th.
Please discuss any questions you might have surrounding Evusheld with your healthcare provider.
Data indicate that Evusheld will NOT be effective against the following variants (percentages are national averages):
- BQ.1.1 (35.7%)
- BQ.1 (27.4%)
- XBB (18.3%)
- BF.7 (3.9%)
- BA.5.2.6 (1.1%)
- BA.4.6 (0.7%)
- BF.11 (0.5%)
- BA.2.75.2 (0.2%)
These seven variants together made up ~87.8% of cases on average nationwide as of December 26th.
The most concerning data point this week in terms of the COVID-19 variant landscape is the significant jump in cases that were caused by the XBB variant. Last week, XBB caused 11.2% of total cases, and this week it increased to 18.3%. This is important because anytime a variant begins to crowd out other dominant variants, this is usually because it has some sort of growth advantage due to being able to be more infectious than the other dominant variants.
In the case of XBB, we do have a good amount of data to pull from since Singapore was the first country to experience a wave induced by this particular variant back in October. Here is what we know about XBB based on what happened there (and in subsequent countries since that time):
- XBB had an explosive effect on case numbers, mainly due to its ability to evade any natural immunity and reinfect those who were previously infected with COVID-19.
- At the time of the Singapore XBB wave, it was being referred to as “one of the most infectious strains yet.”
- For those who were infected with XBB, they tended to test positive for a bit longer than usual.
- Vaccines did protect against severe disease, hospitalization, and death. It is important to note that Singapore was one of the top 10 most highly vaccinated (and boosted) countries in the world, which undoubtedly was a factor in this data point.
- While it caused an explosive and sharp increase in case numbers, the wave burned out rather quickly (within a month or so).
Something else to keep on our periphery radar is that there appears to be an offshoot variant of XBB that has been detected in the US (thought to have evolved from XBB infections in the New York state area) called XBB.1.5. It is not on the CDC’s variant tracker just yet because it has not yet met the criteria of being detected nationwide. As we have experienced throughout the pandemic, it is important to keep an eye on what is happening with New York State’s COVID-19 hospitalizations, since they seem to always the “bellwether” for what is about to come in the US overall as a whole. Other factors besides the immune evasiveness of XBB.1.5 that are also likely contributing to their increased hospitalization rate right now are waning of vaccine and natural immunity, indoor holiday gatherings, cold weather, and overall lack of mitigation efforts. But it is noteworthy that New York’s COVID-19 hospital admission rate is the highest since late January 2022.
COVID-19 in the News
- The New England Journal of Medicine published an article on how well the mRNA bivalent COVID-19 booster held up against the newer variants (including BQ.1.1 and XBB). Data indicated, “Persons who received the BA.5-containing bivalent booster had better neutralizing activity against all Omicron subvariants (especially against BA.2.75.2, BQ.1.1 and XBB) than those who received 1 or 2 monovalent [original] boosters.” As someone with CLL / SLL, if you have not yet received your bivalent booster yet and are eligible, CLL Society highly encourages you to do so.
- There was a great editorial article written in Nature that is worth the read this week called, “There’s No Room for COVID Complacency in 2023.” It provides a good overview of the current state of COVID-19 worldwide right now, and where efforts need to be focused in 2023.
In Summary
You all know the drill at this point! If you are eligible and have not yet received your COVID-19 bivalent booster, please consider obtaining it as soon as possible. If you have known exposure to COVID-19 or are experiencing any symptoms at all, please get tested early, preferably with a PCR test, and call your healthcare provider. Paxlovid must be started orally within five days of symptom onset and Remdesivir must be started intravenously within seven days of symptom onset. Wear a well-fitted N95 mask (or KN95) while around others who live outside of your household. You can obtain quality N95 masks free of charge from many local pharmacies across the country. Practice good hand washing often and use hand sanitizer. Practice social distancing and avoid large indoor gatherings or crowded situations as much as possible. Ensure there is good air-flow and ventilation whenever you are around others by opening windows or doors as weather allows, and/or using a quality HEPA air purifier if you have one available. And know where to access your COVID-19 Action Plan.
Keep learning, and please stay well.
Robyn Brumble, MSN, RN
Director of Scientific Affairs & Research
CLL Society
