Home » CLL / SLL Patient Education Toolkit » Keeping Track of Lab Results
Keeping Track of CLL Lab Results.
In science and medicine, information is constantly changing and may become out-of-date as new data emerge. All articles and interviews are informational only, should never be considered medical advice, and should never be acted on without review with your health care team.
The CLL Society has created this spreadsheet, Keeping Track of Lab Results, to allow you to follow your routine blood test results over time. While your healthcare team may have access to some results at a given point in time, they may not have the complete picture. Download this template and make a habit of completing it. One single test result is never as telling as the overall trend. Printing out this report and bringing it to meetings with your healthcare providers will help you economize appointment time and may simplify a complicated picture by showing the trend.
Each lab test indicated at the top of the sheets includes a brief description about the test. Clicking the question mark next to each test will lead you to a brief description. Below the question mark, you will see the average range of normal values for that test. Ranges may vary slightly from lab to lab, so feel free to adjust them if your lab uses different ranges. We’ve included pages (or worksheets) for CBC, Blood Chemistries, and Immunoglobulins. Hyperlinked arrows allow you to easily navigate between the pages, or you can select the tabs at the bottom of the worksheet. To help visualize the trends in your blood counts, the values you enter on the CBC chart are being automatically plotted on the graph in the Chart Tab.
How to use the Keeping Track Patient Records Spreadsheet
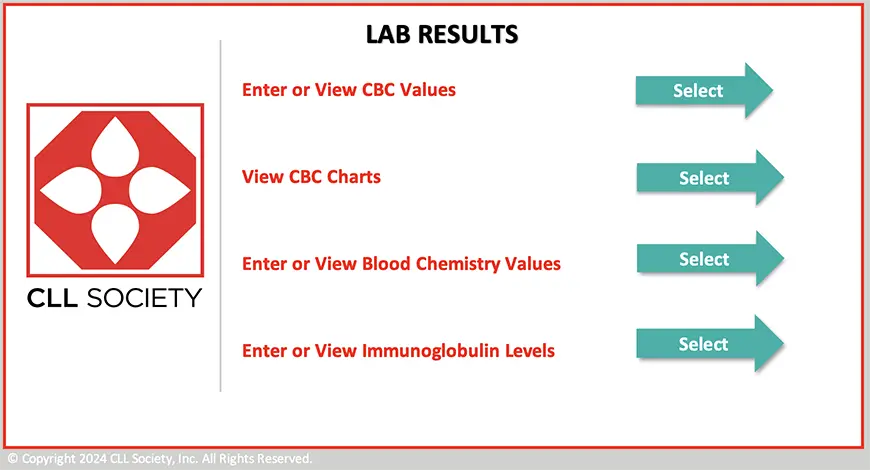
Opening Page
This spreadsheet will help you to keep track of your lab results. Select the arrow corresponding to the section you want to access (or you can select the tabs at the bottom of the spreadsheet).
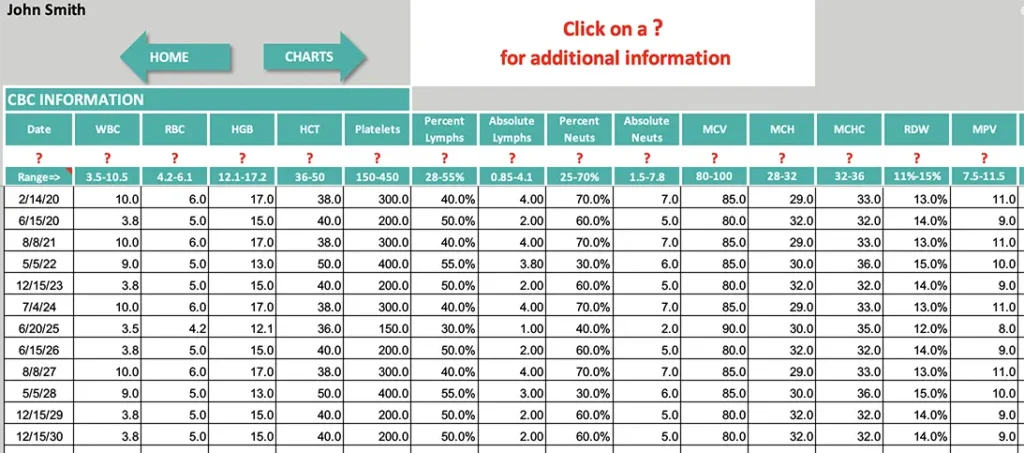
CBC Information
Enter your name (John Smith in this example), the date and your lab results in the boxes below each label. You can click on the “?” below each label to find out more information. The Absolute Lymphocytes and Absolute Neutrophils will be automatically calculated based on the value in the WBC field and the % Lymphs or % Neuts fields. Add notes about treatments, dosages, side effects or any other pertinent information. You can print this spreadsheet to take to your appointments.
Data from the red blood cell (RBC), hemoglobin (HGB), hematocrit (HCT), platelets, absolute lymphocytes and absolute neutrophils will be automatically charted in the Charts Field. You can view them by clicking on the Charts arrow, or the tab labeled charts at the bottom of the spreadsheet.
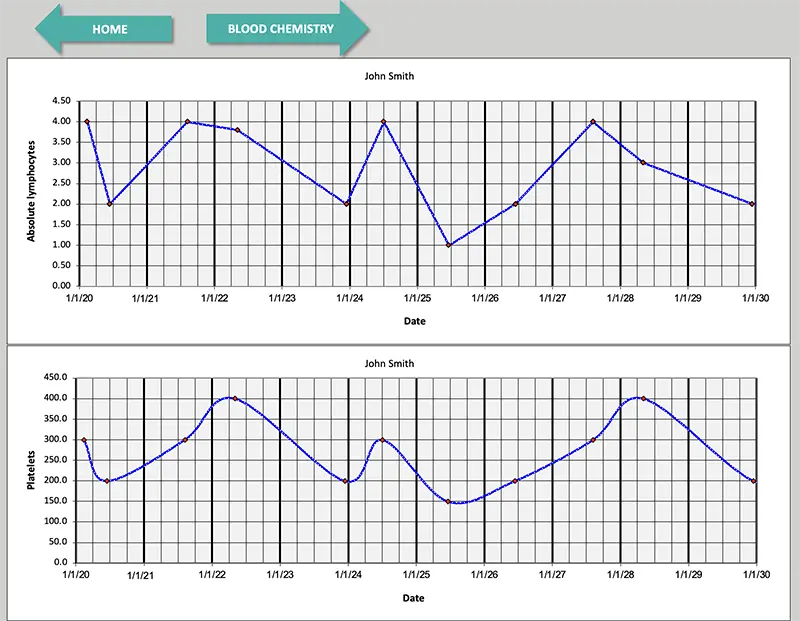
CBC Charts
The information from the CBC Values sheet is automatically charted here. Your name is automatically populated on each chart. You can print these charts (red blood cell (RBC), hemoglobin (HGB), hematocrit (HCT), platelets, absolute lymphocytes and absolute neutrophils) as well.
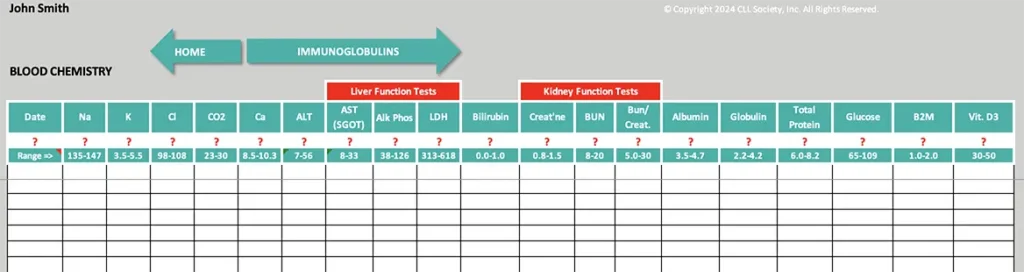
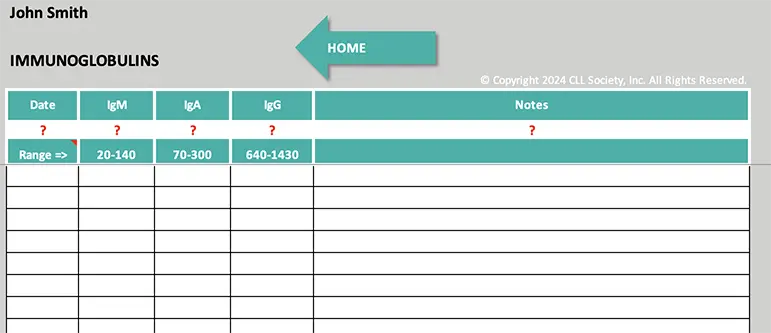
Blood Chemistries and Immunoglobulins
Enter the date and the blood chemistry values and immunoglobulin values. Use the arrows to navigate between screens.
Written by Betsy Dennison 3/8/15, updated by Liza Avruch and Brad Hedrick 1/22/25